


The labor cost of accreditation is regressive: it falls hardest on the institutions least equipped to absorb it.
A flagship research university in a reaffirmation year — with an AACSB business school running its own AoL cycle underneath it — has a dedicated accreditation office, a professional institutional research lab with five or six analysts, an assessment director with staff, an associate provost whose job description is built around this work, and budget flexibility to fund course releases.
A regional comprehensive with 8,000 students has perhaps a third of that infrastructure. A small private liberal arts college with 1,200 students has, in many cases, a single overworked associate dean who also chairs a department. A community college with 6,000 students has a chief academic officer absorbing the work between two other portfolios.
In other words: the flagship has an actual org chart for accreditation.
Everyone else runs it on a shadow org chart that the Part 2 of the series had mapped: the unofficial second structure of faculty and staff doing this work on top of the jobs they were hired for.
All four of these institutions face broadly the same documentation expectations from their regional accreditor. They face the same federal compliance regime. They face the same programmatic accreditors when they offer programs in nursing, education, business, or engineering.
The standards do not scale to institutional capacity. The labor required to meet them does.
What the Original Vanderbilt Study Already Knew
The same 2015 BCG/Vanderbilt study that produced the famous $27 billion figure included a finding that has been quoted far less often than the headline number. Vanderbilt's own CFO, Brett Sweet, called it one of the study's most significant findings: small and medium-sized colleges were disproportionately impacted by federal regulations, with compliance eating up a larger share of their expenditures than at wealthier peers.
The study also estimated about $6 billion in annual compliance costs for community colleges as a sector, though with only one community college in the 13-institution sample, that figure rests on thin ground. Its direction matches everything else we know.
The FAFSA Verification Case Study
If you want to see how the regressive math plays out at the institutional level, look at FAFSA verification — a federal requirement that sits outside accreditation but shows the same pattern more cleanly.
A 2020 working paper by Guzman-Alvarez and Page estimated that institutional compliance costs of FAFSA verification totaled nearly $500 million annually, with the burden falling disproportionately on public institutions and community colleges. The costs by sector are striking:
Community colleges spend approximately 22 percent of their financial aid office operating budget on verification.
Four-year publics spend 15 percent.
Four-year privates spend 1 percent.
The authors put it bluntly: the mandate places a disproportionate burden on institutions serving the neediest students. Verification load follows low-income enrollment, not institutional size: the students most likely to be selected are those with the greatest financial need.
Verification is also exactly the kind of high-volume, rule-bound document work that the current AI conversation points to first, and it's a fair example. Matching fields, flagging discrepancies, and assembling files is volume labor, the layer where automation helps.
But notice the asymmetry the cost data reveals: the institutions carrying 22 percent of an office budget are also the ones with the least capacity to deploy and supervise that technology well. The tool that would help them most is the one they are least able to adopt safely.
Small Private Colleges: Same Standards, No Staff
Community colleges absorb the load through volume — high enrollment, lean staffing, and chronic underfunding. Small private institutions face a different version of the same problem.
A small private with 1,200 students faces broadly the same documentation expectations as a regional public with 18,000 students. But with no dedicated accreditation staff, an IR office that may be one part-time analyst, and faculty already on three or four committees each.
One study points the other way, and it deserves a hearing. A 2020 University of Minnesota dissertation, The Cost of Accreditation for Small, Private Institutions of Higher Education, found that accreditation cost two small private colleges about 0.13 percent of their operating budgets per year. In budget terms, that is modest.
But consider what it means in practice. At a college with, say, a $40 million operating budget, 0.13 percent is about $52,000 a year — roughly one modest salary. Except no one is hired with it. The work lands on the associate dean, the part-time analyst, and the faculty already on four committees, on top of the jobs they were hired to do. A budget share tells you whether an institution can afford accreditation. It doesn’t tell you who carries it. At a 1,200-student college, that gap is the whole story.
Hartwick College’s 2012 self-audit referenced in the Vanderbilt study, estimated annual compliance costs around $300,000 but estimated the real figure could reach 7 percent of its non-compensation operating budget once decentralized costs including faculty time were counted. A 7 percent budget line that is mostly invisible because it is distributed across more than 100 roles instead of concentrated in one office.
This is where the labor cost gets genuinely structural, and where the AI argument runs into the regressive math head-on.
Small institutions cannot solve the problem by hiring an accreditation director; the marginal cost of that hire is too large relative to the operating budget. They cannot solve it by automating documentation, because the per-institution cost of a compliance platform is roughly the same as at a flagship.
And the temptation that follows is the dangerous one: with no dedicated staff, the under-resourced institution is the one most likely to let automation creep past the volume work into the judgment work — to let the tool decide what the evidence means, not just collect it.
As the previous post argued, much of what looks like document labor is compressed judgment. The institutions with the least capacity to keep a human on those calls are precisely the ones the regressive math pushes hardest toward giving them up.
The only remaining coping strategy is to absorb the load into the existing workforce — the same pattern that produces the shadow org chart.
The Programmatic Layer Makes It Worse
For institutions running professional programs, programmatic accreditation sits on top of regional accreditation, not in place of it. A nursing program holds CCNE or ACEN. A business school adds AACSB. An education program adds CAEP. Engineering adds ABET. Counseling adds CACREP. Each has its own self-study cycle, evidence requirements, site visits, and annual reporting.
The Vanderbilt study estimated programmatic accreditation alone at roughly $3 billion annually. For institutions running multiple professional programs, the labor load is not additive but compounds further. Because the same faculty often hold leadership roles across several accreditation processes at once, and the same IR analyst is pulling overlapping but non-identical data cuts for each.
A regional comprehensive with nursing, education, and business programs is effectively running four parallel accreditation cycles on staggered timelines. There is rarely a year in which none is in active review.
What This Argues For
The regressive distribution of accreditation labor is not a bug in any single accreditor’s standards. It is a structural feature of a system designed around uniform documentation expectations applied across radically different institutional capacities.
There are practical responses worth taking seriously: shared-evidence frameworks across regional and programmatic accreditors, joint site visits where programs hold multiple accreditations, capacity-aware reporting cycles for institutions below certain enrollment thresholds, and consortium-based institutional research support.
AI belongs on that list, but only if it is scoped honestly.
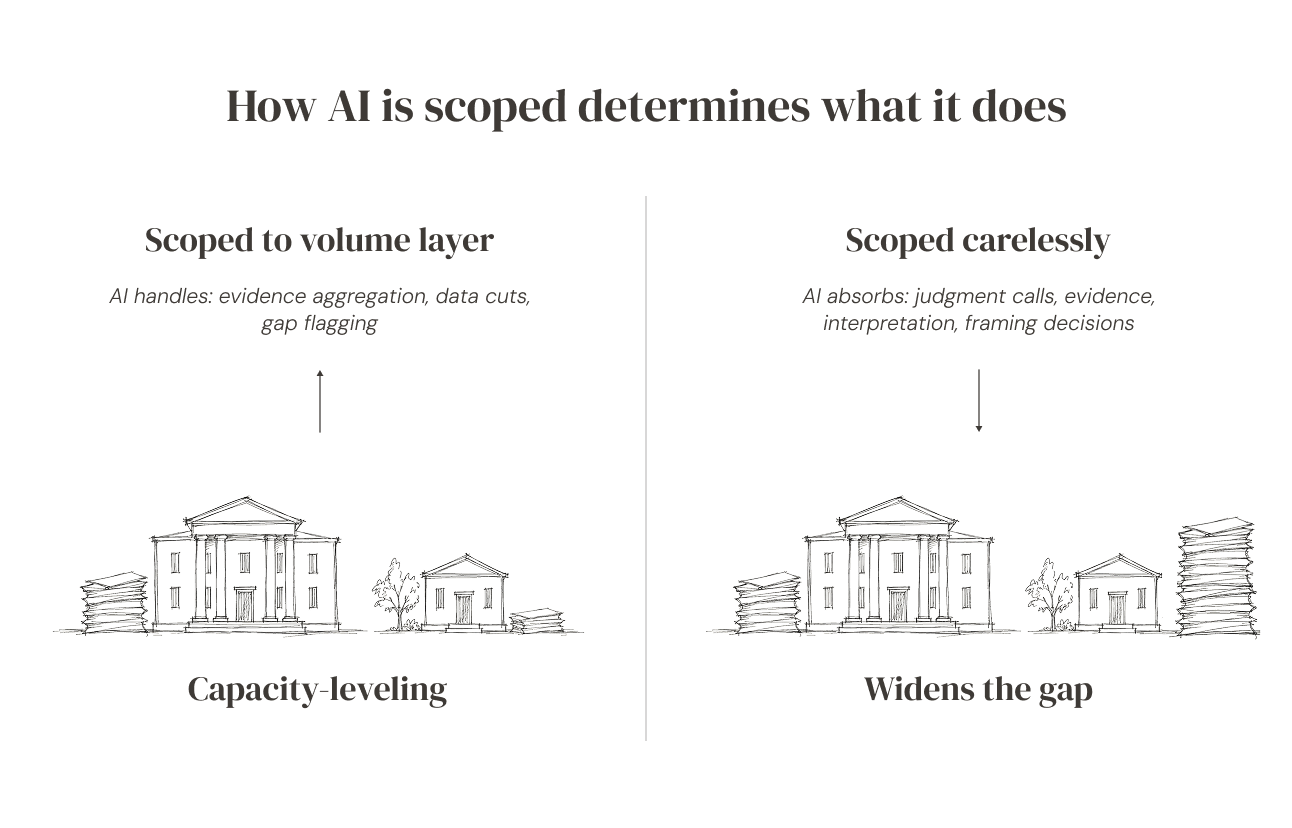
The promise it can plausibly keep is at the volume layer — aggregating evidence across overlapping programmatic and regional requirements, generating the repeated data cuts a single IR analyst now produces by hand, flagging gaps before a site visit. For an institution running four parallel cycles with one analyst, that is not a marginal convenience; it is the difference between a sustainable process and an unsustainable one. The promise it cannot keep, is the judgment layer: deciding what the evidence means, which fights are worth having, how to frame a weakness for a specific reviewer.
The regressive math makes both halves of that sentence matter more here, not less. The institutions with the least slack stand to gain the most from genuine volume relief, and stand to lose the most if automation quietly absorbs the judgment work too.
Separating the paperwork from the judgment calls is hard anywhere, as Part 2 argued. At a small institution, where the same person pulls the numbers and decides what they mean, it is hardest of all.
Used for the paperwork, with people keeping the judgment calls, AI can help level the field. Used carelessly, it widens the very gap it claims to close.
None of these responses are new ideas. All of them require accreditors and institutions to acknowledge openly that the current distribution of labor is not equitable and is not sustainable for the institutions doing the most expensive version of the work.
The honest question for the next decade of higher education policy is not whether accreditation is worth its cost in aggregate. It is whether we are willing to redesign the system so that the institutions serving the most vulnerable students are not also the ones paying the highest labor cost to remain accredited.
That is the conversation the final post in this series turns to.

Next in the series: Making the labor visible — the practical changes institutions, accreditors, and policymakers can make to redistribute the load.